Picture This: When the Ocean Blooms
Average seasonal biomass of major phytoplankton groups at coastal (B1) and offshore (BY31) stations in the northern Baltic Proper. Vertical lines mark the spring study period (March–May).
Hjerne et al., Frontiers in Marine Science (2019), CC BY 4.0.The ocean is in constant flux. Currents push and pull over 300 million cubic miles of water in planet-sized loops, circulating heat and energy on a global scale. Essential building blocks like carbon, nitrogen, and phosphorus shuttle through the ecosystem, seeding billions upon billions of chemical reactions. Much of marine life, from tiny plankton to gigantic baleen whales, lives by the rhythms of the tides and seasons of Earth’s largest habitat.
Understanding such a vast and interconnected system requires mixing and matching ideas from biology, chemistry, physics, and every subdiscipline between them. Even so, the ocean remains almost unfathomably complex. In the jargon of computer science—the field that gave oceanography the algorithms to crunch complicated data sets—the sea has too many variables, inputs, and outputs to contemplate.
Consider the emerald-green mats of algae that blanket large parts of the North Atlantic every spring. These seasonal blooms power the oceanic food web by injecting valuable nutrients into the system. Some blooms are so large that they can be seen from space, and some can poison the water. The why and when of algal blooms explains a lot about how energy moves through the ocean, including how climate change is reshaping that movement.
As simple creatures made up of only a single cell, algae lack eyes, hearts, and brains. It’s not commonly known but algae are microbes, not plants; still, they use photosynthesis to trap energy from sunlight within the chemical bonds of sugar, the fundamental fuel of metabolism. But what algae, more properly called phytoplankton, lack in complexity as individuals, they more than make up for as a community during a bloom.
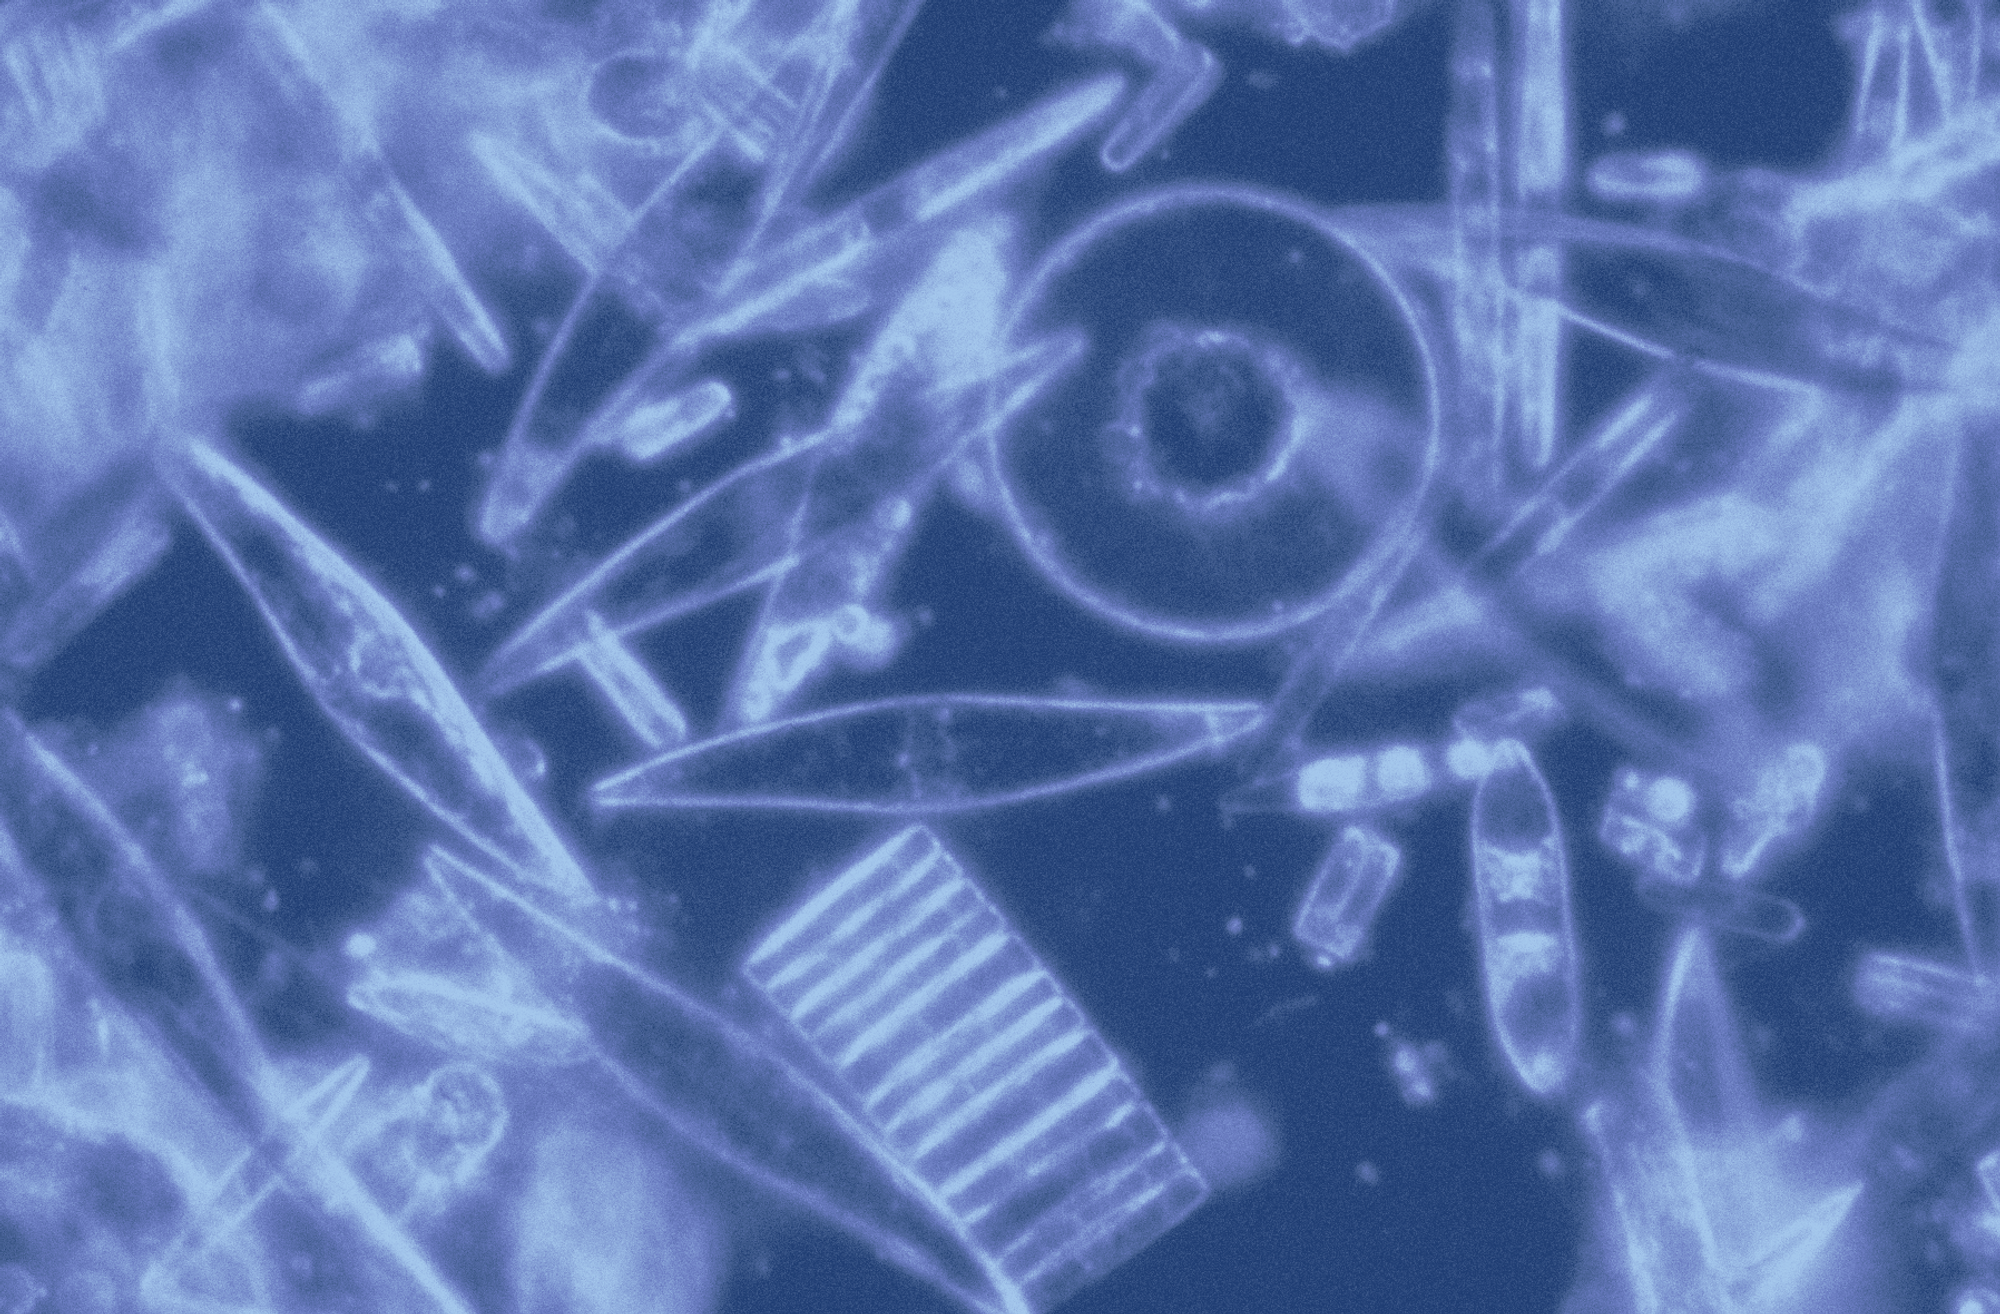
Assorted diatoms from Antarctica seen through a microscope, 1983.
NOAA Corps Collection/Prof Gordon T. Taylor, Stony Brook UniversityGeometric diatoms—single-celled algae enclosed in glass-like walls—appear first in early spring, gorging themselves on nutrients to grow and multiply quickly. Dinoflagellates—tiny organisms propelled by whiplike appendages—are more circumspect, taking a slow and steady approach that sets them up for long-term survival as spring shifts to summer. Dozens of other bacteria, protists, and microbes, each with their own quirks and timelines, add numbers and diversity to the bloom.
Algal blooms spread far and wide, covering millions of square miles of ocean. But there’s an unseen world of activity just beneath the surface: A frantic mixing caused by the wind, waves, and heat pulling and pushing the algae up, down, and up again. Near the surface and bathed in sunlight, algae capture more energy than they need to survive, which they put to work by making extra sugar or growing larger. Deeper down and shaded by the layers of water above them, the opposite occurs; the algae shrink in size and numbers.
Drawing on this phenomenon, Harald Sverdrup, former director of the Scripps Institution of Oceanography, published his critical depth hypothesis in 1953, which has since acquired near-canonical status in the field. He argued that so long as the mixed layer of algae stayed above some “critical depth,” where total energy captured by photosynthesis exactly balanced the total energy lost from metabolism and predators, the algal community would continue to grow, divide, and eventually bloom.
The hypothesis simplifies the energy put to work by the algae (“primary production”) as a combination of brightness and depth, both easily measurable in the 1950s. It also assumes that energy loss is a fixed line item in the algae energy budget, which saves scientists from getting too deep into the weeds of subtle, hour-to-hour or depth-to-depth shifts in metabolism and activity. Sverdrup’s theory was the first and most influential to explain the phenomenon of phytoplankton blooms.
To support his point, Sverdrup showed a “striking agreement” between his calculations and the data collected by the Weather Ship M as it sailed the Norwegian Sea in the spring of 1949. Algae bloomed when the observed mixed layer was shallower than the calculated critical depth and withered away when it extended past that threshold.
Sverdrup’s equation is simple and straightforward by oceanographic standards, often deployed to introduce basic biological concepts in undergraduate courses. Sverdrup’s paper marked a striking new approach in oceanography—the idea that the squishy, messy biology of marine life could be described and even predicted with rigorous mathematical precision. Even rival theories that favor different explanations for bloom timing, like turbulence or shifting predator-prey dynamics, owe much of their underlying framework to Sverdrup’s model.
When scientists plot the data of algal bloom size over time, it looks something like a lopsided, right-angled triangle. One side is a steep cliff. The other is a gradual, downward ramp. Within that outline, smaller shapes fit together like puzzle pieces, each representing a different species of algae in the bloom.
These graphs show how the density (depicted by height) and species makeup (colors) of algae blooms shift across a year in the Baltic Sea near Sweden, averaged from observations made as far back as the 1970s. Graphs like this are the bread and butter of oceanographers everywhere.
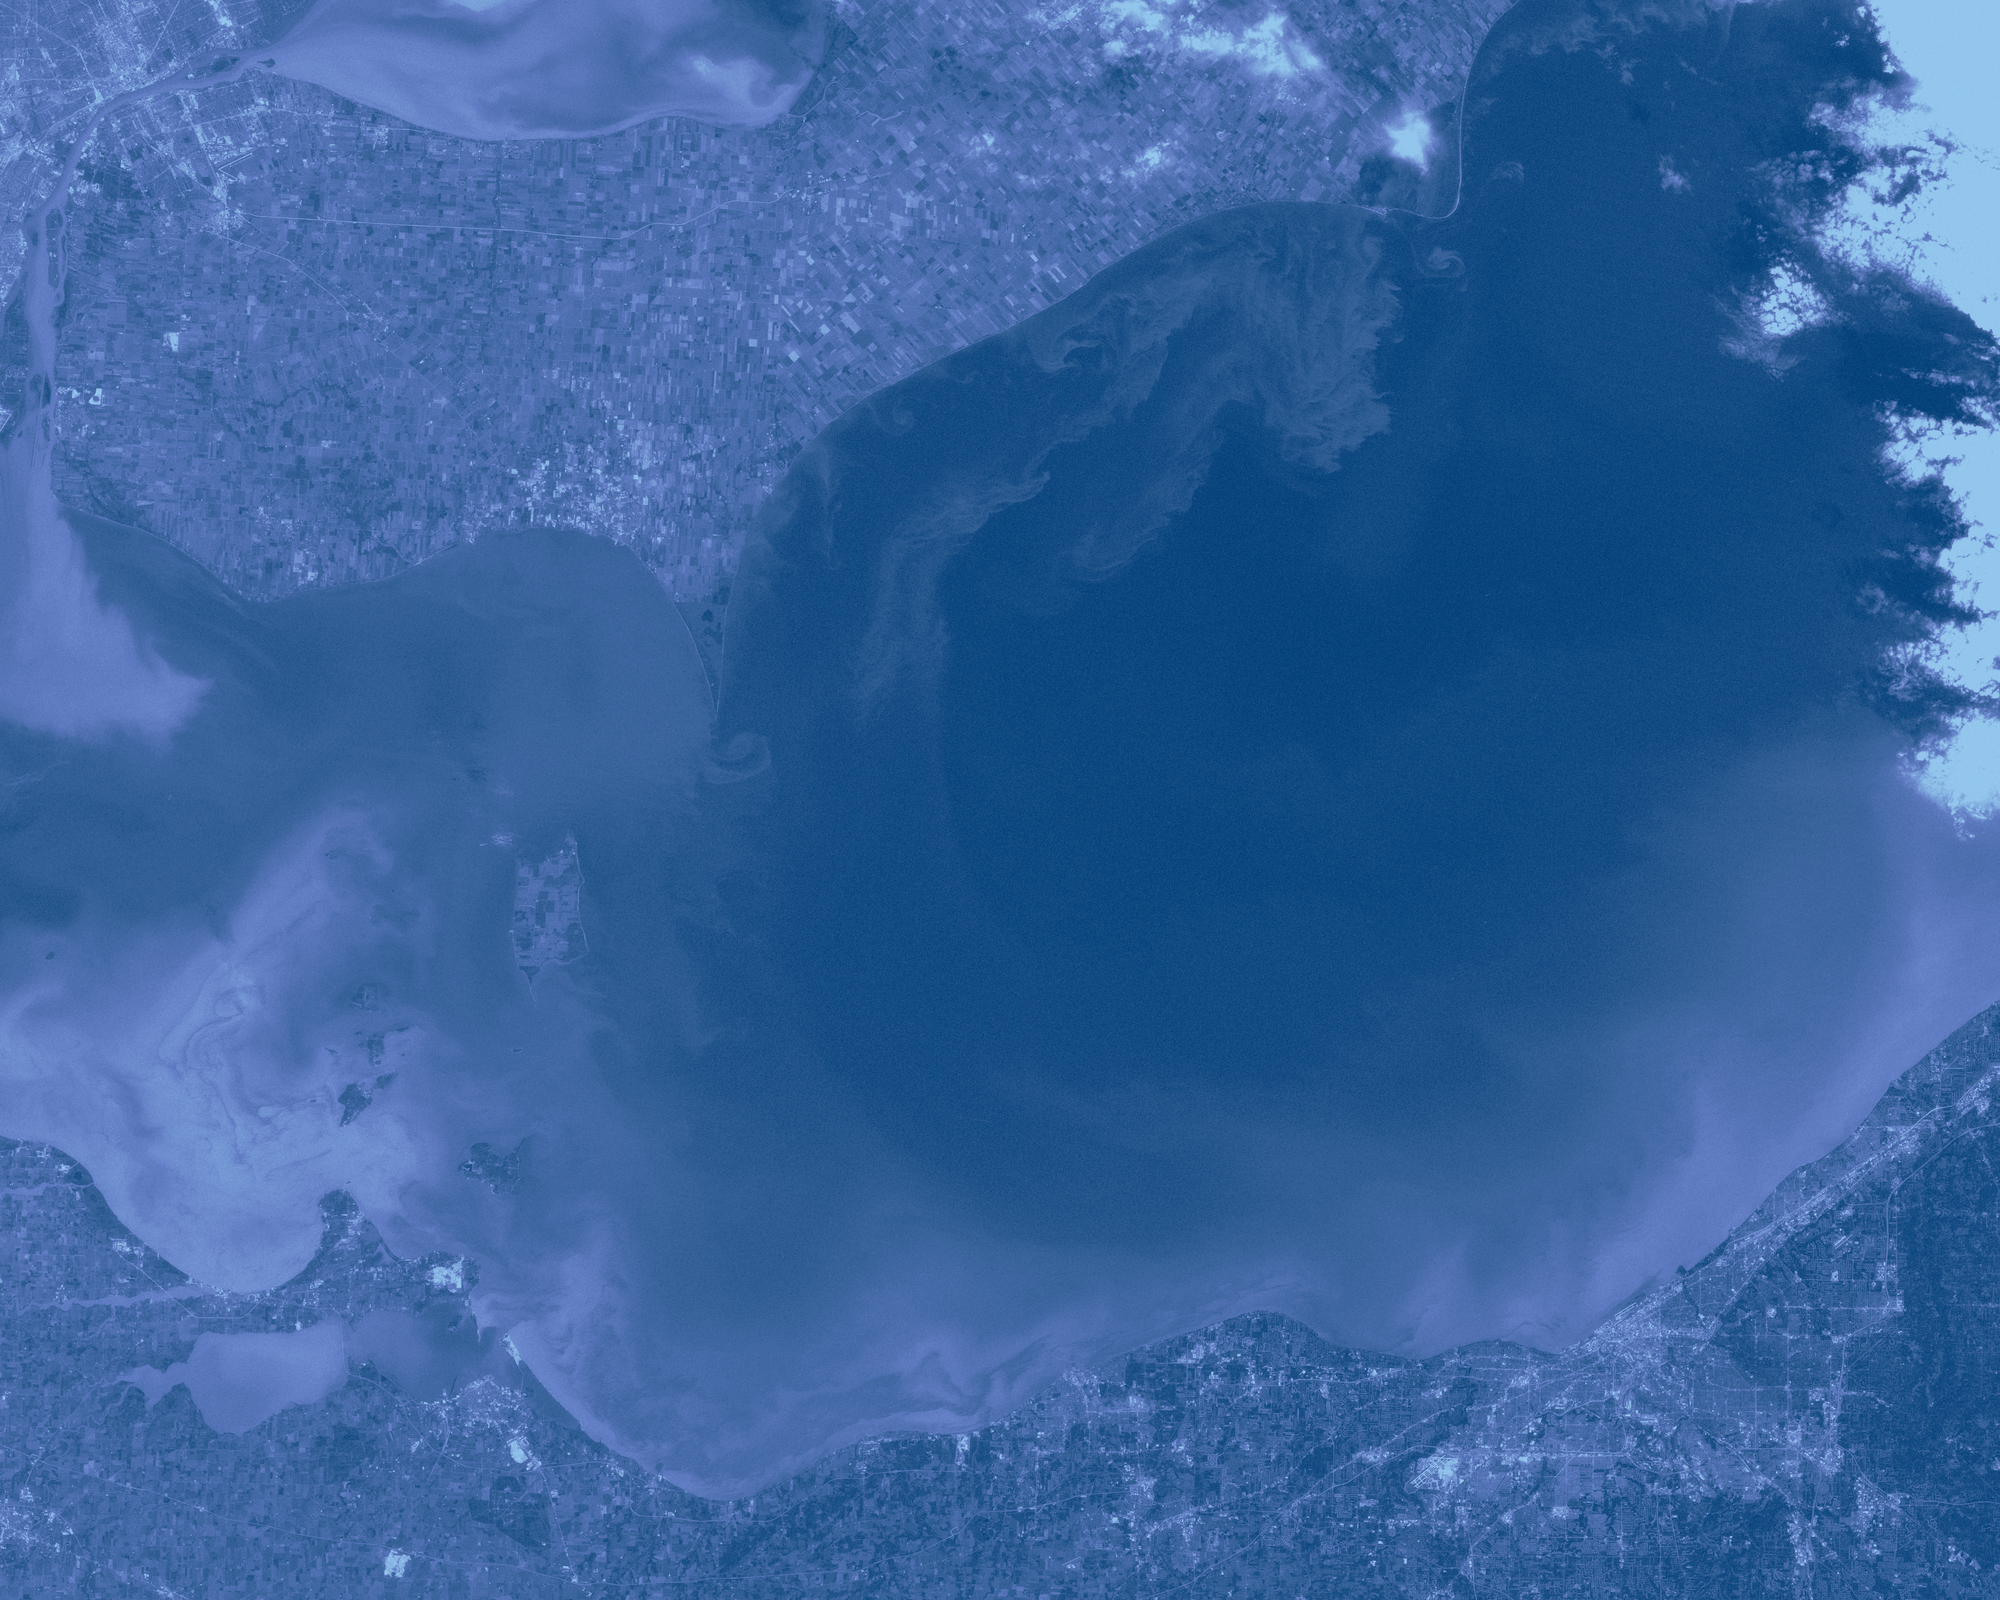
Toxic algae bloom in Lake Erie, 2011. Photographed by Jesse Allan and Robert Simmon.
NASA Earth ObservatoryComparing the two top panels (A and B) reveals how the blooms changed over the decades. Pre-1989 blooms are explosive, growing rapidly but burning out by mid-May. Recent blooms peak a week or two earlier, have more dinoflagellates, and stretch out much deeper into the summer. Contrasting the two bottom panels (B and C) shows that bloom location matters too: Offshore blooms show up later than coastal blooms, and tend to feature fewer diatoms and more dinoflagellates and cyanobacteria.
The data depicted here postdate the critical depth hypotheses by decades, yet pursue the same basic question that Sverdrup did: How does the environment influence the timing and size of algal blooms? Put another way, why is Panel A different from B and Panel B from C?
Contemporary oceanographers approach the question of environmental influence on algae blooms a bit differently from those in Sverdrup’s day. Instead of building individual equations from scratch based on specific hypotheses about how variables like light and primary production relate to each other, researchers feed reams of data into a statistical program, which tests thousands of iterations of those relationships, called models, in just minutes or hours. The core idea of translating intricate biological phenomena into the unambiguous language of mathematics is still there, transformed and supercharged by over 60 years of technological advancement.
Parts of Sverdrup’s hypothesis remain relevant. Overall bloom timing should be explained by sunlight (“global irradiance,” in the jargon of the study) and how deep the algae circulate under the surface. This prediction holds true in the Baltic sea: Blooms show up earlier when it’s sunny and when the mixed layer depth is shallow.
But blooms also show up earlier when winds are calm—an effect the 1953 equation didn’t account for. Expanding into examinations of bloom size and species composition, neither of which were investigated by Sverdrup, reveals even more complexity. Ice cover, wind, and mixed layer depth all contribute, but how much they contribute depends on the type of algae and location of interest.
These results are evocative of the critical depth hypothesis’s place in the field today: It’s still worth including as part of a larger analysis, but often falls short as an answer on its own. The simplicity that was once the greatest strength of Sverdrup’s equation, enabling its global application and adaptation, now also illustrates its limitations. Compared to newer, more nuanced hypotheses powered by new technologies like high-resolution satellite images and big data, critics might call Sverdrup’s work quaint, an antiquated artifact of a bygone era.
Ever ahead of his time, Sverdrup himself would be unsurprised by these critiques. He correctly pointed out several potential pitfalls to his own hypothesis. For example, areas with an unusually large number of algae-eating predators can suffer extra losses, leading to a shallower-than-expected critical depth. Alternatively, strong swimming microbes can resist the force of the ocean pulling them downward, leading to blooms even if the mixed layer slips beneath the calculated critical depth.
Yet despite this, the critical depth hypothesis has stuck around like a barnacle glued to the underside of a ship, absorbing decades of intellectual effort and likely millions of dollars in funding. Why has science held onto Sverdrup's proposal so doggedly, and what does its entrenchment, despite innovations and discoveries since, say about science as a process and philosophy?
Scientific theories can be valuable for two reasons. The first is by offering an explanation for a mysterious, important phenomenon like plate tectonics or evolution. The second is by creating a framework that guides the thinking and testing of new ideas in the field. Theories of the second sort don’t need to be 100 percent correct; they just need to be interesting enough to motivate scientists to try them out.
Sverdrup’s critical depth hypothesis is firmly in the second category. Rather than closing off lines of inquiry by reducing algal blooms to the output of a few choice variables, his clearly laid out assumptions and testable predictions opened new lines of research. They gave oceanographers an early foothold in conceptualizing one of the ocean’s most important biological phenomena.
After six decades—and counting—of scientific poking and prodding, Sverdrup’s legacy flows through the field today. Much of our understanding of algae blooms references and builds off Sverdrup’s basic model, extending and adapting it with the benefit of new technologies, observations, and hindsight. And while the ocean has proven far more intricate than any single equation, Sverdrup’s insight persists as a reminder that even imperfect ideas can chart the course for decades of discovery. ♦
Subscribe to Broadcast